Siemens
Data visualisation animation
The Challenge
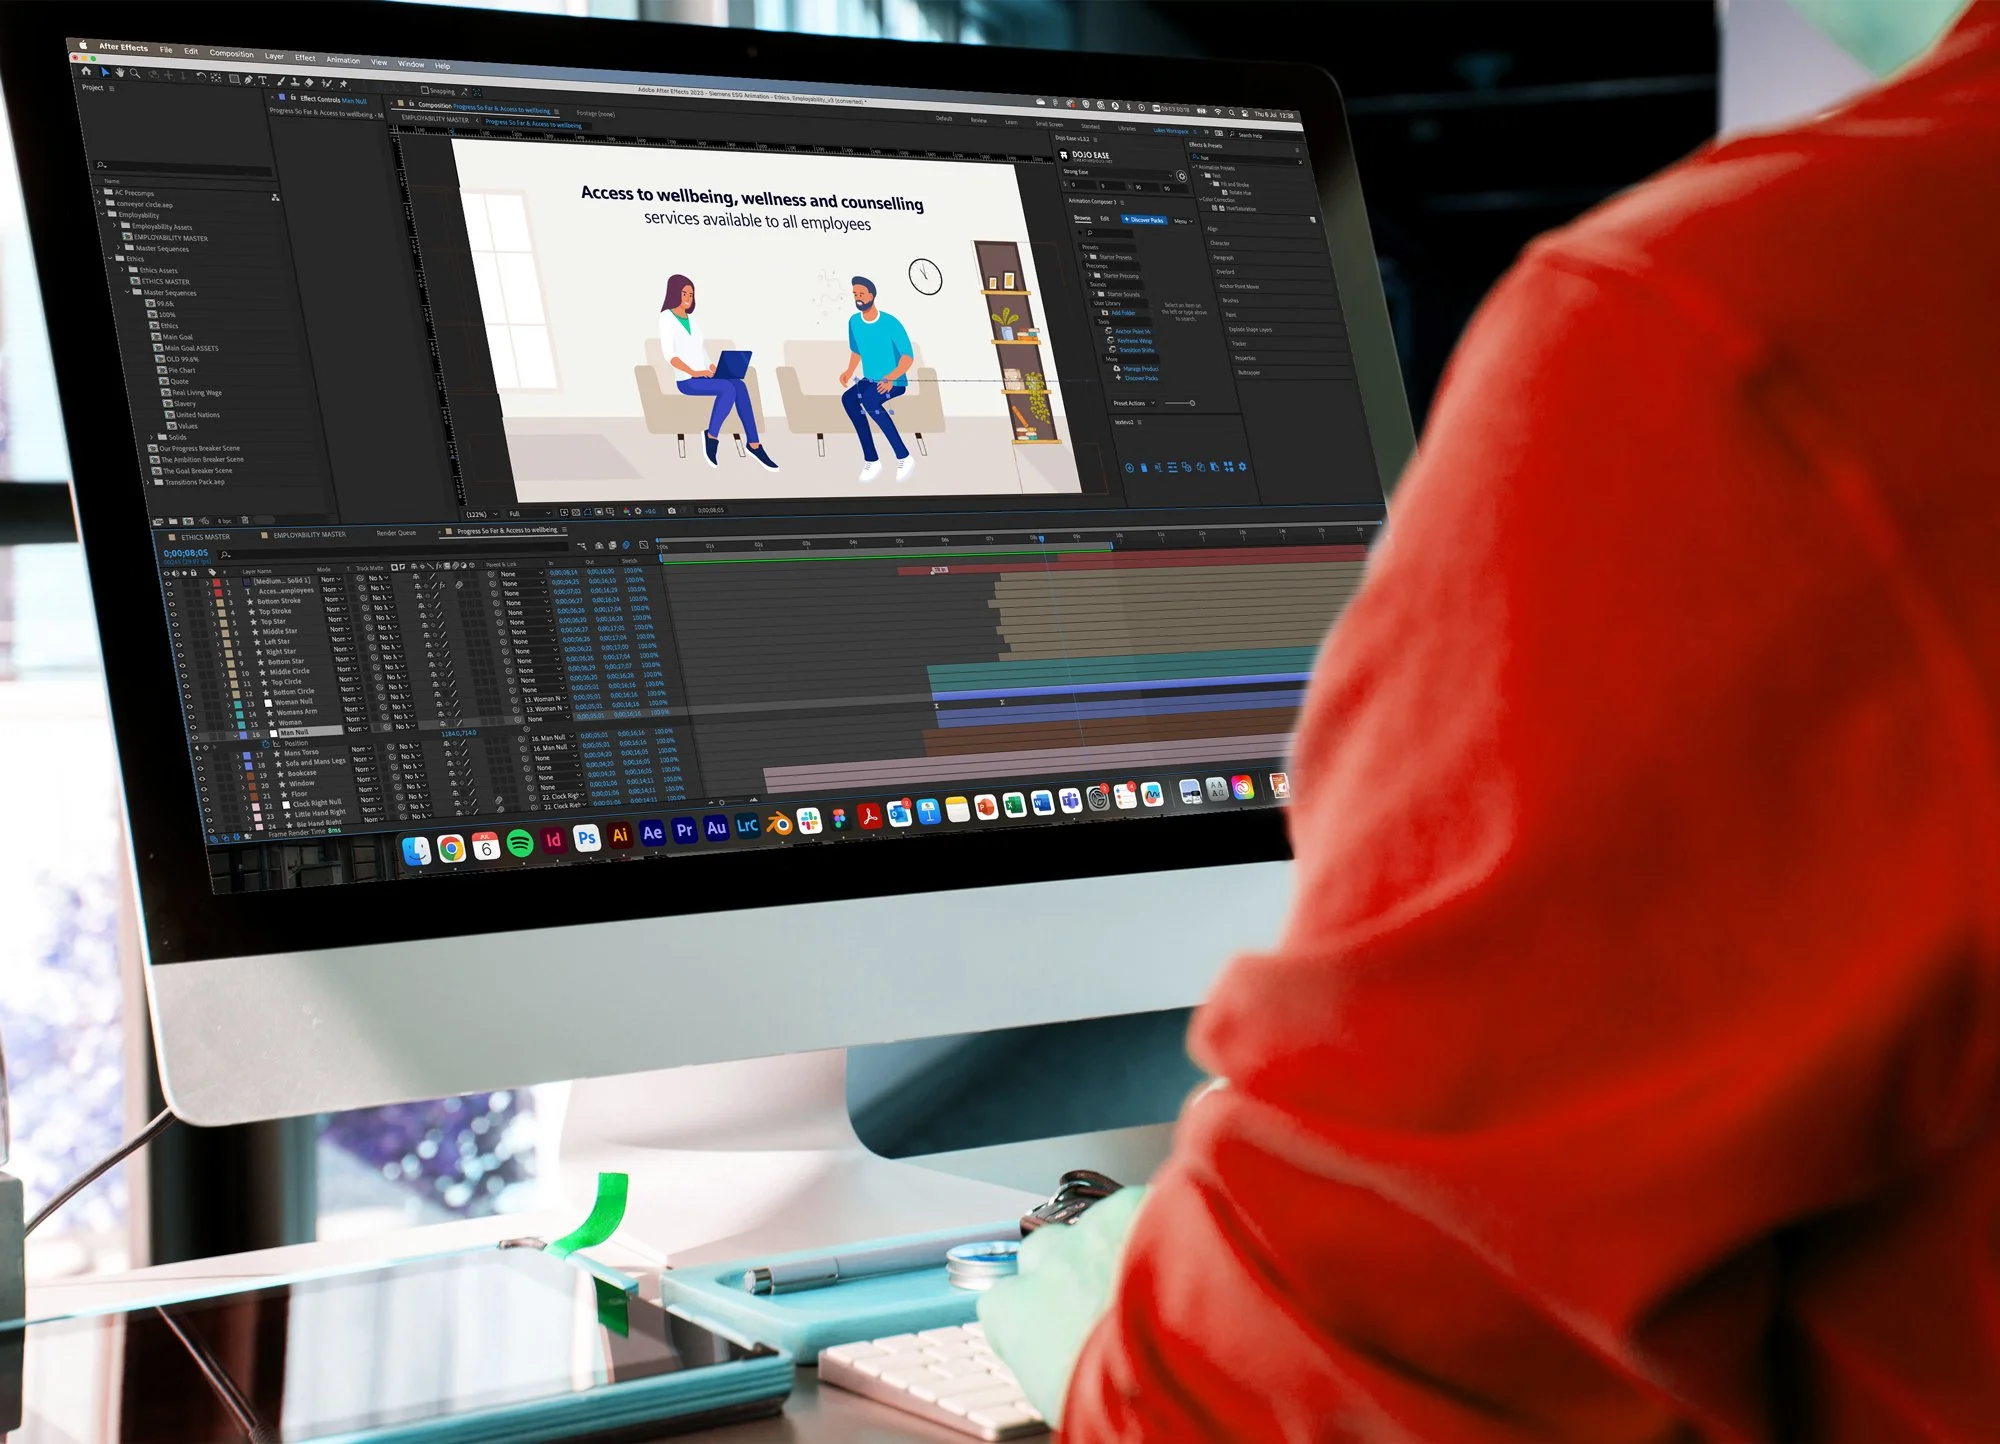
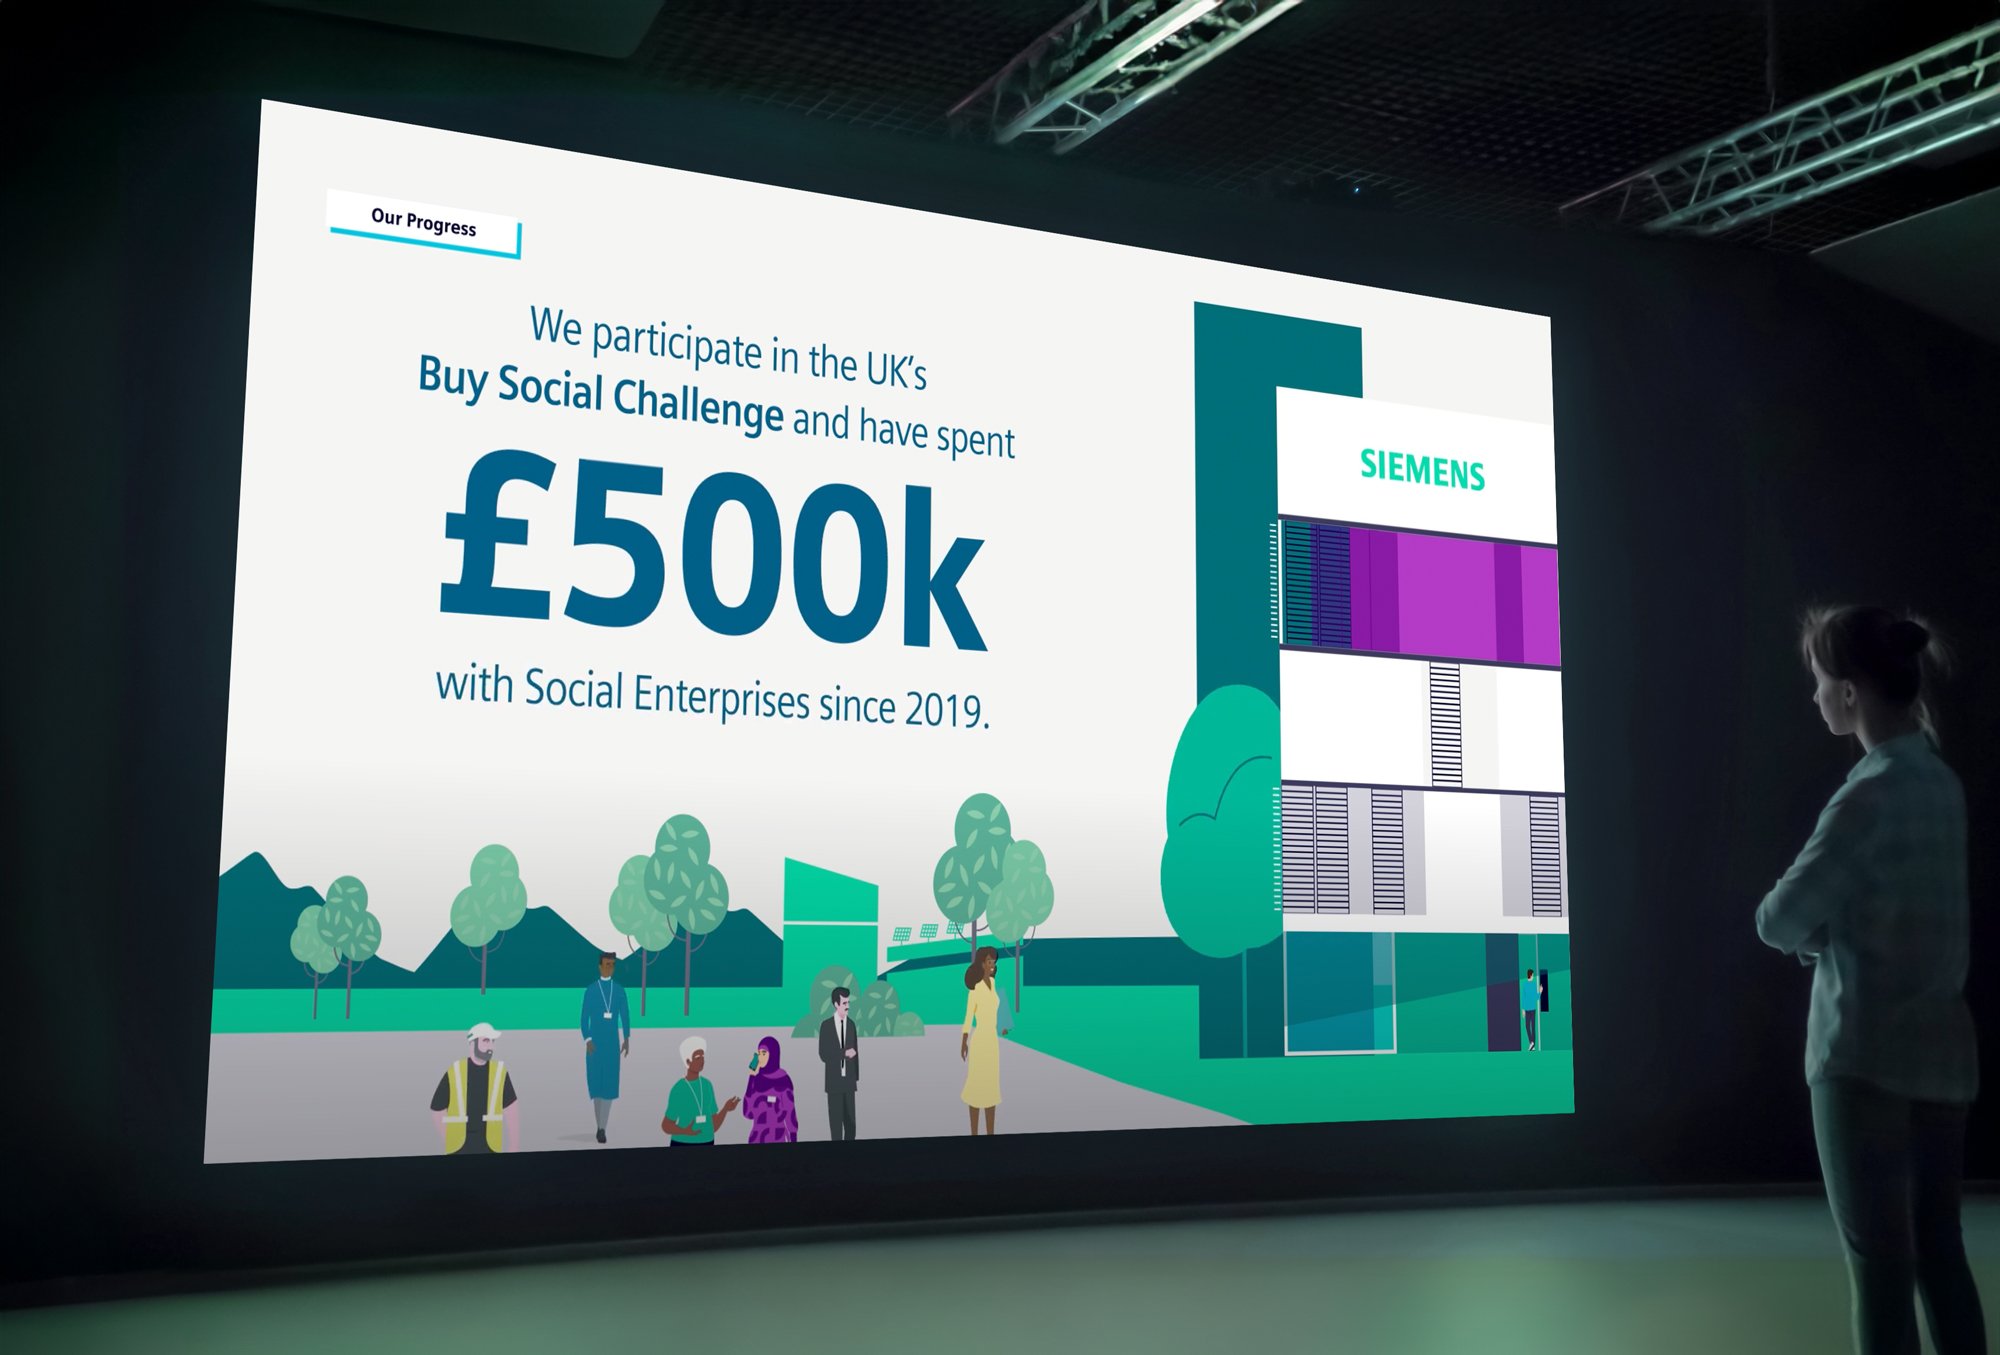
Developing and delivering an extensive animation using data visualisation techniques and character animation, showcasing the actions taken by Siemens to achieve key targets and other Environmental, Social, and Governance reporting requirements. The brief outlined a very tight deadline of three weeks to create the animation ahead of a networking event where it would be displayed in large format for the duration of the event.
The Solution
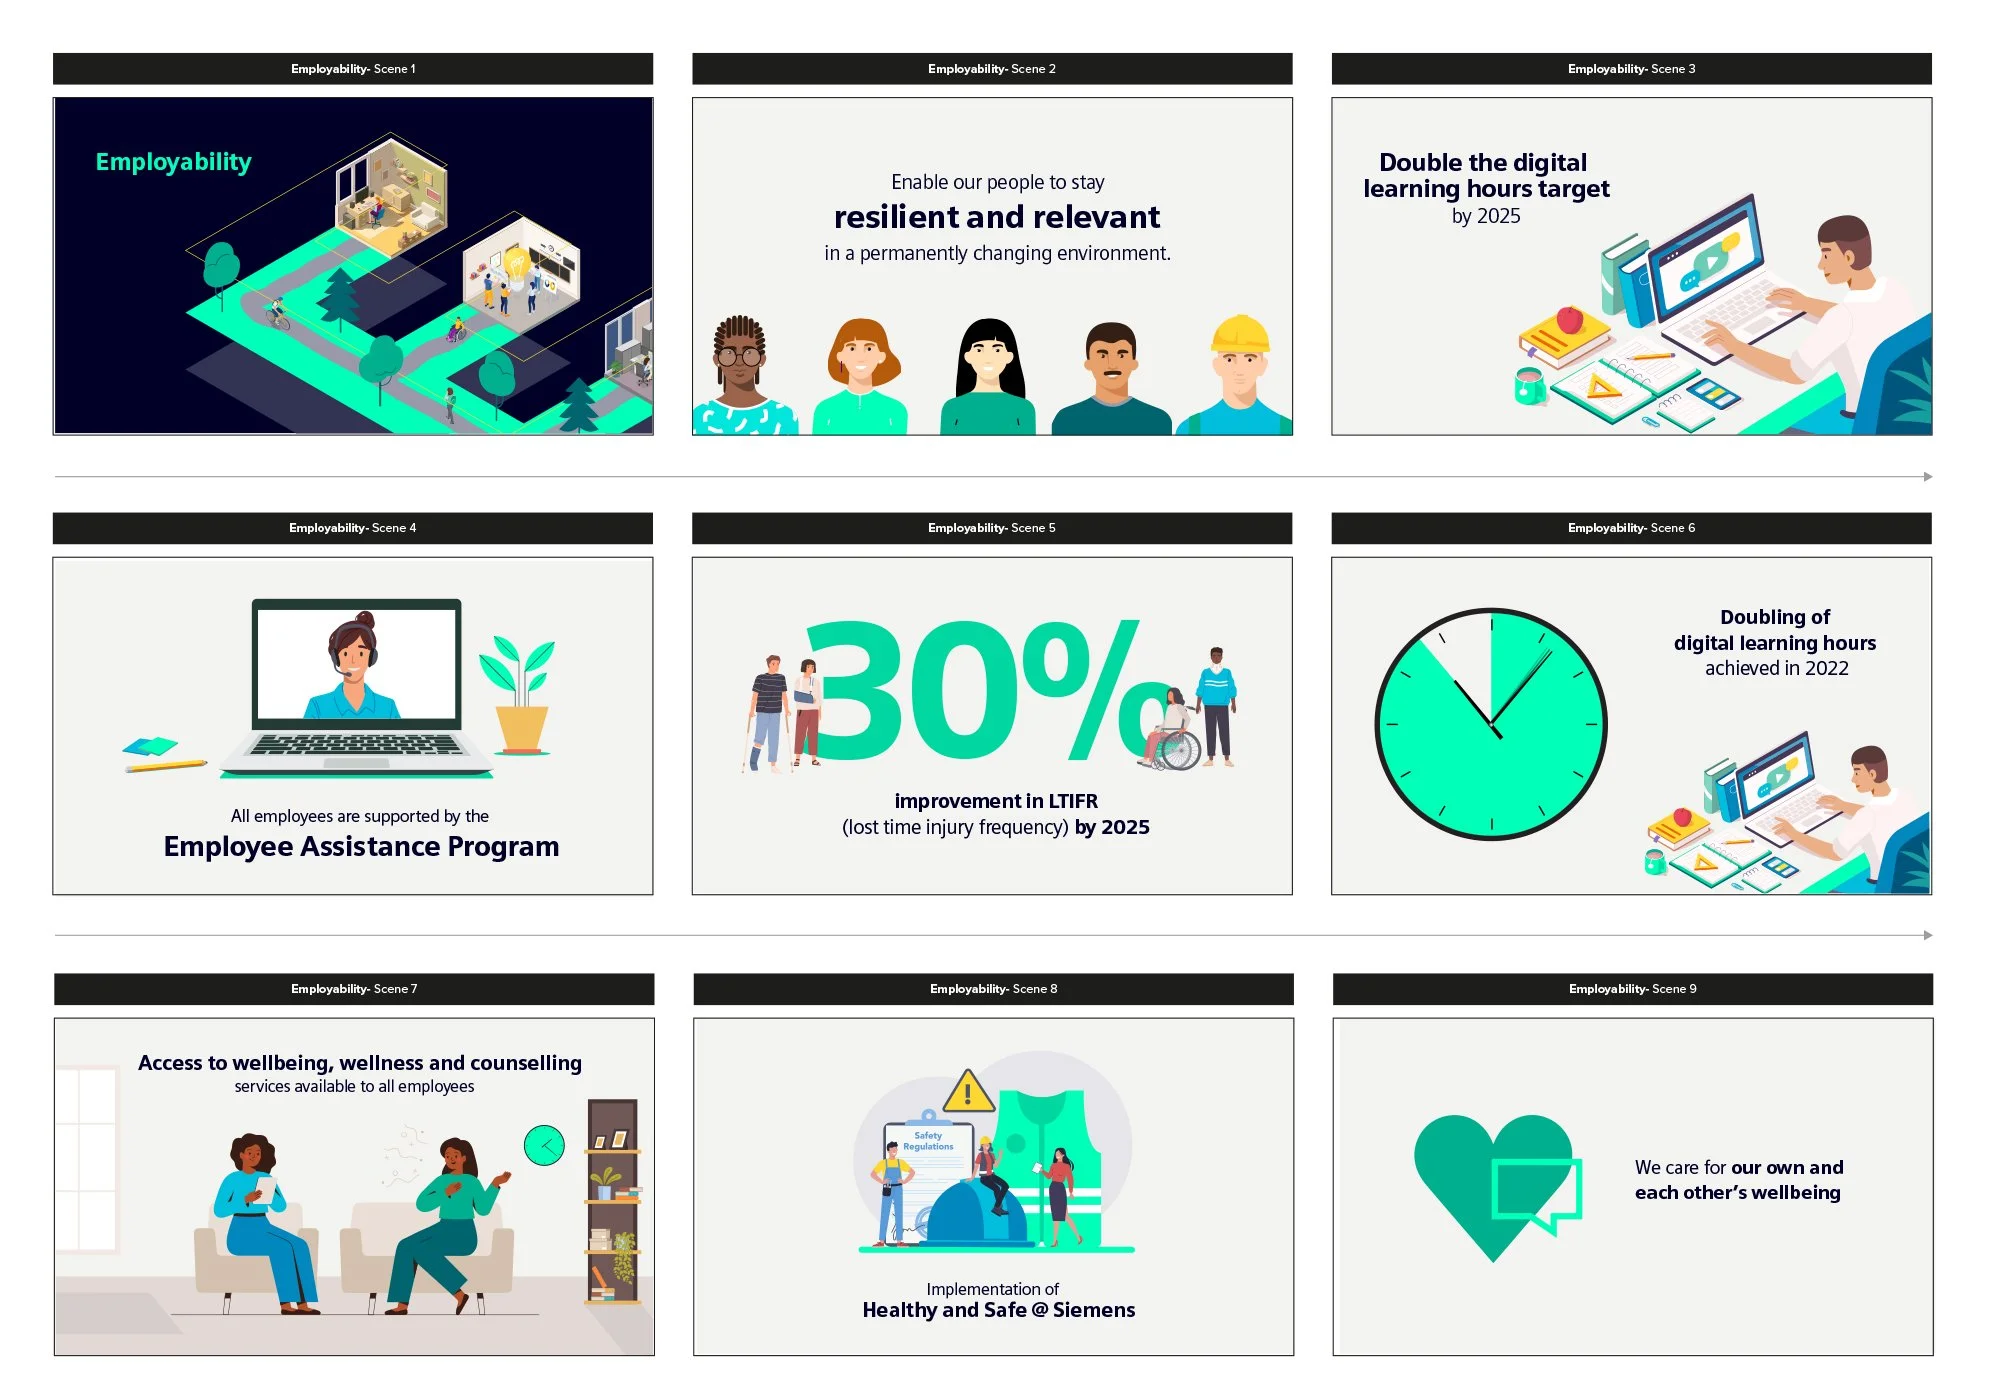
Utilising Siemens’ sustainability DEGREE framework (Decarbonisation, Ethics, Governance, Equity, Employability), an animation was created that centred on easily accessible, key messages and chapters. Each of these chapters represented a part of the acronym, with an individual, tailored narrative to demonstrate results using ‘Ambition, Achievements, and Status’ statistics.
The Process
Digest the brief
Script analysis
Visual aesthetic moodboard & pitch
Storyboard and scene illustration
Animate
Render for approval
Revisions and final sign-off
Render and supply in final format